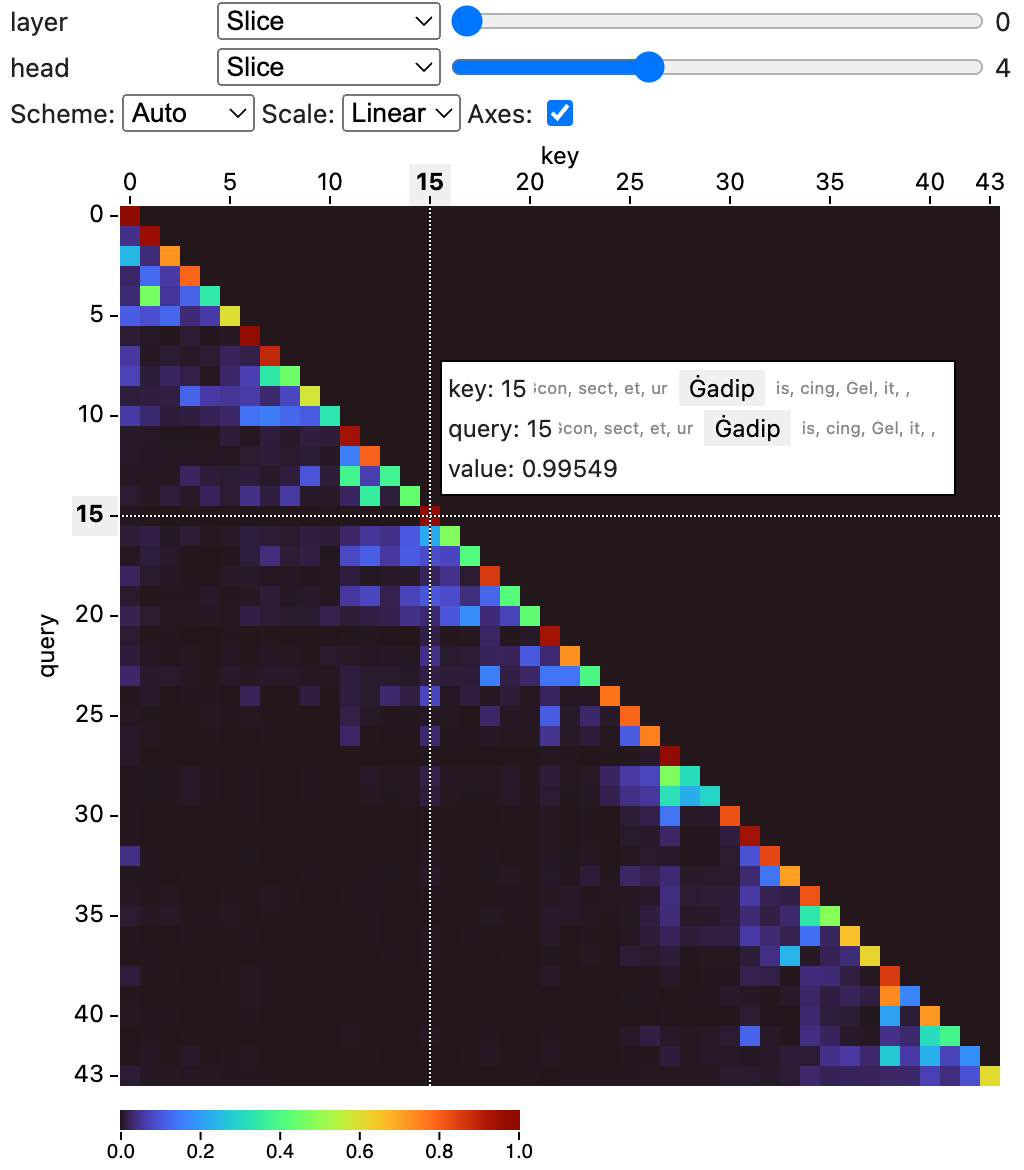
A Jupyter widget for visualizing tensors as heatmaps.


Project description
Tensor Visualizer
This is a package to visualize tensor data in notebooks.
Install
pip install tensor-visualizer
Usage
You can use this widget in a notebook to visualize tensor data.
The widget supports numpy ndarrays, PyTorch and Tensorflow tensors,
as well as MLX tensors.
from tensor_visualizer import TensorVisualizer

# Visualize a 4-dimensional numpy array.
import numpy as np
data = np.random.randn(5, 10, 10, 10)
widget = TensorVisualizer(data)
widget
from tensor_visualizer import TensorVisualizer

# Visualize a 4-dimensional torch tensor.
import torch
data = torch.randn((5, 10, 10, 10))
widget = TensorVisualizer(data)
widget
You can name dimensions with the names argument:
TensorVisualizer(data, names=["batch", "channel", "height", "width"])
and label indices for the dimensions with the labels argument:
TensorVisualizer(
    data,
    names=["batch", "channel", "height", "width"],
    labels=[["b1", "b2", "b3"], ["ch1", "ch2"]]
)
By default the widget infers the color scale automatically from your data. To configure the color scale, you can set the scale_domain, scale_type, and scale_scheme properties:
# Set the scale domain to [1, 100], log scale,
# and use the viridis color scheme.
w = TensorVisualizer(data, scale_domain=[1, 100], scale_type="log", scale_scheme="viridis")
# You can also set it after creating the widget
w.scale_domain = [0, 1]
If you are using inferred scales, you can access the inferred scale properties with current_scale_domain, current_scale_type, and current_scale_scheme. These properties are available only after the widget has been shown.
You may use the permute argument the re-order the tensor dimensions in the visualization. For instance, permute=[2, 0, 1, 3] shows dimension 2 first, then dimension 0, 1, and 3. The last two dimensions are used in the heatmap.
Parameters
| Name | Description |
|---|---|
tensor |
The tensor to visualize. |
names |
The names for dimensions in the tensor. |
labels |
Lists of labels for dimensions in the tensor. |
default_views |
Specify the default views for each dimension, supported options are: slice, small-multiples, min, max, and mean. |
scale_domain |
Specify the scale domain. If unspecified, the widget will infer the domain automatically. |
scale_type |
Specify the scale type (linear or log). The default is linear. |
scale_scheme |
Specify the scale color scheme. If unspecified, the widget will infer the scheme automatically. |
permute |
Permute the order of the tensor's dimensions. |
Development
This project consists of a Svelte library for the frontend component, and Python code for the widget.
To setup for frontend development, run:
npm install
npm run dev
You'll get a development server (usually at http://localhost:5173) that hosts an demo page of the frontend component.
To build the frontend package, run:
npm run build
To build the Python package, run:
hatch build
To develop the widget, you can start a Jupyter Lab instance and load the example notebooks in the examples folder:
hatch run jupyter lab
Release history Release notifications | RSS feed

Download files
Download the file for your platform. If you're not sure which to choose, learn more about installing packages.
Source Distribution
Built Distribution
Hashes for tensor_visualizer-0.1.0-py3-none-any.whl
| Algorithm | Hash digest | |
|---|---|---|
| SHA256 | b7bdeacef9b443403b3712f6c4b6279c122034d4b296a7768197a275f2d0f871 |
|
| MD5 | 8d5a956302a132ad06c78845d4bba3d3 |
|
| BLAKE2b-256 | d701c895ba3966f7f0d8d1efb68fbb65b6d4ff53a5b4124e328e8d49a46382f9 |


