Provides support for a cftime axis in matplotlib


Project description
nc-time-axis
Support for a cftime axis in matplotlib


Installation
Install nc-time-axis either with conda:
conda install -c conda-forge nc-time-axis
Or pip:
pip install nc-time-axis
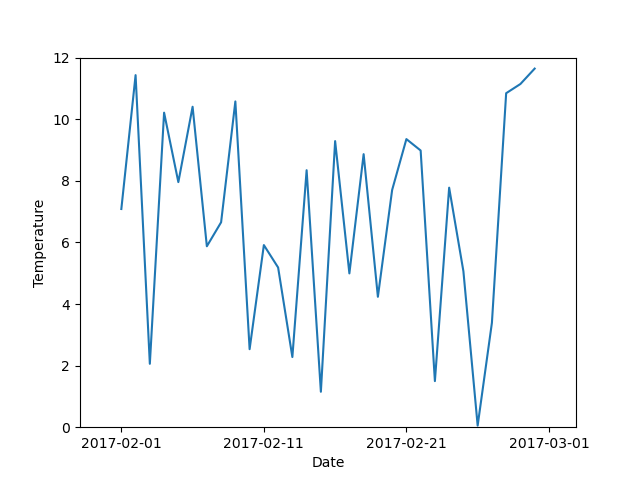
Example
import random

import cftime
import matplotlib.pyplot as plt
import nc_time_axis

calendar = "360_day"
dt = [
    cftime.datetime(year=2017, month=2, day=day, calendar=calendar)
    for day in range(1, 31)
]
temperatures = [round(random.uniform(0, 12), 3) for _ in range(len(dt))]

plt.plot(dt, temperatures)
plt.margins(0.1)
plt.ylim(0, 12)
plt.xlabel("Date")
plt.ylabel("Temperature")
plt.show()
Reference
- cftime - Time-handling functionality from netcdf4-python.
- matplotlib - Plotting with Python.


Download files
Download the file for your platform. If you're not sure which to choose, learn more about installing packages.
Source Distribution
nc-time-axis-1.4.0.tar.gz
(14.3 kB
view hashes)
Built Distribution
Close
Hashes for nc_time_axis-1.4.0-py3-none-any.whl
| Algorithm | Hash digest | |
|---|---|---|
| SHA256 | f39dc5faca2a7ec9952904b5a5b88ee8dadbf41c7a2e42584eef53a1b8ee4577 |
|
| MD5 | da9b95420ae2eac460425ff8e9fc099e |
|
| BLAKE2b-256 | 366189996e46426441ea454ccc3a557bf37e8d5ffa6efdb7c397b739dbc0f253 |


